
The chart and table below show the average number of children born to one woman and the average age of women when they had their first child in two countries between 1920 and 2019.
Summarise the information by selecting and reporting the main features, and make comparisons where relevant. Write at least 150 words.


It is quite common to encounter two charts or a chart and a table in IELTS Academic Writing Task 1. However, there is a common misconception that the type of chart determines the type of task. This is not true. Allow me to demonstrate.
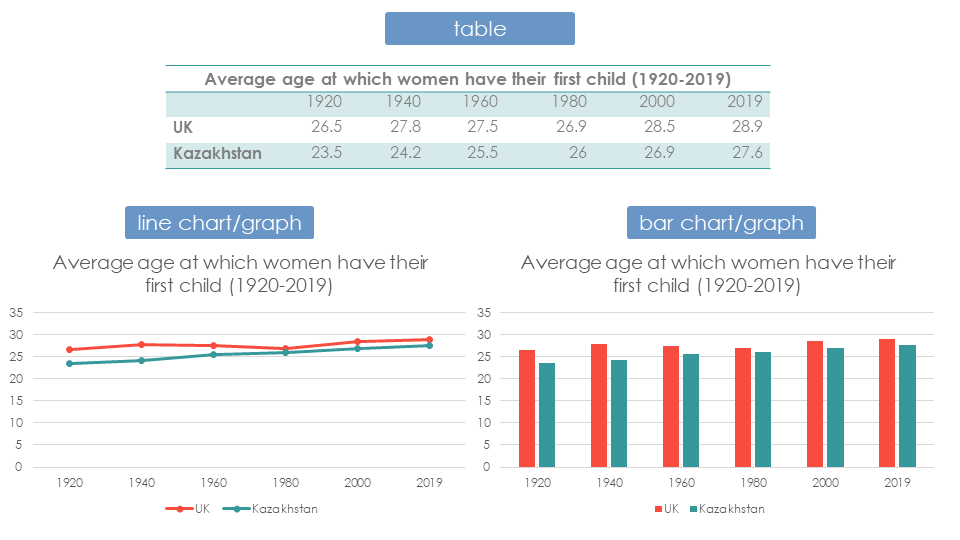
I presented the data from the table in the form of a line chart and bar chart. The information is exactly the same. That’s why in my courses we don’t group charts by type, but rather we group charts and tables with dates (in our case, we have six time periods) and those without dates.
The dates are in the past, which means you must use the past tenses in your report.

The first paragraph is your introduction and overview.
First of all, you should introduce the task or tell the reader what information you have in your charts. Quite often we simply paraphrase the task. Here’s my introduction.
The line graph illustrates how many children women had on average in the UK and Kazakhstan from 1920 to 2019, while the table provides a woman’s average age of first-time motherhood for the same countries and time period.
The second part of this paragraph is an overview. Write one or two sentences summarising what you’ve learned. The purpose of writing an overview is to provide the reader with a general idea of the events or data presented. It is customary to begin with the word "overall" to let the examiner know that this is your overview.
Over time, a general trend of deferring childbearing to a later age and having fewer children overall can be observed in both countries, although women in Kazakhstan had their first child earlier and had more children than their UK counterparts.
It is important to remember to incorporate the information from both the chart and the table while also establishing connections between them.
In your report, you should have at least two body paragraphs. In some cases, you may have three, but avoid having only one. It is important to logically organise the information in your writing. To do so, find a logical way to split the information into body paragraphs.
There are various ways to organise your body paragraphs. Here are two possible structures for our report:

The first approach involves discussing the chart in the first body paragraph, followed by the table in the second body paragraph. The second approach is to focus on the UK in the first body paragraph and Kazakhstan in the second body paragraph. In this report, we used the first structure.
Body paragraph 1:
In 1920, the average British woman gave birth to approximately two children, while the Kazakhstani average was around 3.5. In both countries, the birth rate continued to increase until the 1960s, at which point it peaked at around 2.7 and 4.5 children per woman respectively. Between 1960 and 2019, the numbers generally declined, with the end of the period displaying a rate of approximately 1.8 children per woman in the UK and 3.0 in Kazakhstan.
Body paragraph 2:
In terms of women’s age at first childbirth, females in Kazakhstan preceded those in Britain by about one to four years across all time periods. The average age of giving birth to the first child increased slightly in both countries, from 26.5 in the UK and 23.5 in Kazakhstan in 1920 to 28.9 and 27.6 in 2019 respectively.
The use of the linker "In terms of women's age at first childbirth" at the beginning of the paragraph effectively signals the topic and facilitates sentence cohesion, a key aspect to achieving a Band 7 score.
It is important to only report the most important figures.
This sample report is 211 words long, which is typical for a high-scoring answer. If you struggle to finish on time, aim to write between 170 to 190 words.
What about a conclusion? You don’t need a conclusion in your task 1 report.
To achieve a Band 7+ score in IELTS Writing, it's crucial to fulfil all the criteria that the examiners use for evaluation. In my previous blog, you can learn more tips and techniques to achieve a Band 7+ score in IELTS Writing.
To help you write high-scoring answers more quickly, I have developed online courses that will guide you through the process step by step, ensuring that you meet all of the necessary requirements. By taking these courses, you'll be able to prepare more efficiently and achieve a better score. You can learn more about my courses below.


Don’t forget to download the PDF of our sample report.

10 IELTS Writing Tips to Get Band 7+ Score
Common IELTS Writing Mistakes You Must Avoid to Get a Higher Band Score
© 2014-2026 Fastrack Education ltd. All Rights Reserved
Do you need any help? support@fastrackedu.co.uk
